Position-Sensing Detectors
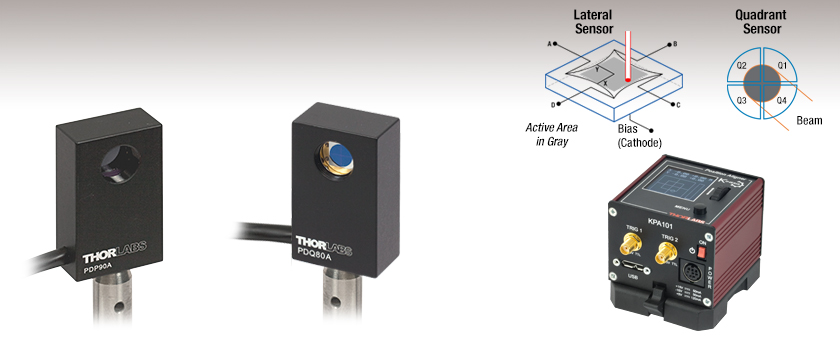
- Lateral Effect and Segmented-Quadrant Sensors
- Compact Footprint
- Compatible with SM05 (0.535"-40) Lens Tubes
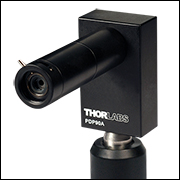
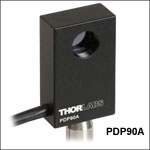
PDP90A
2D Lateral
Effect Detector
PDQ80A
Segmented
Quadrant Detector
KPA101
K-Cube® Controller
Sensor and Controller Sold Separately

Please Wait
Features
- Lateral Position-Sensing Detector
- Wavelength Range: 320 - 1100 nm
- Insensitive to Beam Shape and Power Density
- Segmented-Quadrant Position-Sensing Detector
- Available Wavelength Ranges: 400 - 1050 nm or 1000 - 1700 nm
- Ideal for Automatic Alignment Applications
- Compatible with SM05 (0.535"-40) Lens Tubes
- Compact Footprint: 2.00" x 1.20" x 0.65" (50.8 mm x 30.5 mm x 16.5 mm)
- KPA101 Position-Sensing Detector Auto Aligner Available Separately Below
Thorlabs offers Position-Sensing Detectors (PSDs) that provide precise position measurements of incident beams. The PDP90A detector is a lateral effect PSD and utilizes a silicon photodiode-based tetra lateral sensor to accurately measure the displacement of an incident beam relative to the calibrated center. The detector is sensitive to wavelengths from 320 - 1100 nm and is ideal for measuring the movement of a beam, the distance traveled, or as feedback for alignment systems. The PDQ80A and PDQ30C detectors are segmented-quadrant PSDs and are sensitive to light in the 400 - 1050 nm or 1000 - 1700 nm range, respectively. Their detectors are comprised of four quadrant-shaped photodiodes, and the position of an incident beam is measured by comparing the intensity in each quadrant. These detectors are highly accurate and are ideal for auto-alignment applications. Please see the Operation tab for more information.
These PSDs have a compact design measuring 2.00" x 1.20" x 0.65" (50.8 mm x 30.5 mm x 16.5 mm) and feature internal SM05 (0.535"-40) threads, allowing for easy integration into SM05 lens tube systems. The detectors are also packaged with an 8-32 to M4 adapter to provide compatibility with either imperial or metric mounting posts.
All of the PSDs on this page are compatible with the KPA101 controller, available separately below. The KPA101 K-Cube® Beam Position Aligner is a part of Thorlabs' Kinesis® line of high-end, compact motion controllers. It interfaces with our range of Quadrant and Lateral Effect Sensor Heads and can be used either to measure the position of the beam on the sensor (in open-loop mode) or to generate a signal that can be used as the input for an automated beam steering element (in closed-loop mode). When combined with one or more KPC101 K-Cube Piezo Controller and Strain Gauge Readers, this unit is ideal for such closed-loop beam-steering applications.
| Item # | PDP90A |
|---|---|
| Electrical Specifications | |
| Wavelength Range | 320 to 1100 nm |
| Peak Responsivity | 0.6 A/W @ 960 nm |
| Resolutiona | 0.75 µm |
| Voltage Noiseb | <2 mVpp, <300 µVrms |
| Position Displacement Errorc | ±250 µm |
| Transimpedance Gain | 100 kV/A |
| Photocurrent | 40 µA (Max) |
| Output Voltage Range | Pins 1 and 2: -4 V to 4 V Pin 3: 0 to 4 V |
| Signal Output Offset | 0.3 mV (Typ.), 7 mV (Max) |
| Bandwidth | 15 kHz |
| Recommended Spot Sized | Ø0.2 mm to Ø7 mm |
| Maximum Spot Sizee | Ø9 mm |
| Supply Voltage Requirement | ±5VDC ± 5%, 35 mA |
| Operating Temperature | 10 to 40 °C |
| Storage Temperature | -20 to 80 °C |
| Physical Specifications | |
| Sensor Size (Active Area) | 9 mm x 9 mm (0.35" x 0.35") |
| Sensor Depth | 3.05 mm (0.12") |
| Item # | PDQ80A | PDQ30C |
|---|---|---|
| Substrate | Si | InGaAs |
| Wavelength Range | 400 to 1050 nm | 1000 to 1700 nm |
| Sensor Size | Ø7.8 mm | Ø3.0 mm |
| Gap Size | 42 μm | 45 µm |
| Detector Bandwidth | 150 kHz | |
| Responsivity | 0.4 A/W @ 633 nm | 1 A/W @ 1630 nm |
| Transimpedance Gain | 10 kV/A | |
| Breakdown Voltage | 15 V | 10 V |
| General Specifications | ||
|---|---|---|
| Clear Aperture | Ø0.50" (Ø12.7 mm) | |
| Aperture Thread | Internal SM05 (0.535"-40) | |
| Housing Dimensions | 2.00" x 1.20" x 0.65" (50.8 mm x 30.5 mm x 16.5 mm) |
|
| Mounting Thread | 8-32, 0.25" Min Thread Depth | |
| Metric Adapter | External 8-32 to Internal M4 Adapter (Item # AS4M8E) |
|
| Cable Length (Typical) | 5' (1.5 m) | |
| Connector (Plug) | Hirose HR10A-7P-6P | |
| Mating Receptacle | Hirose HR10A-7R-6S | |
| Weight | 0.25 lbs (114 g) | |
Click to Enlarge
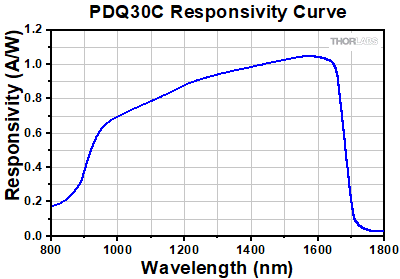
Responsivity Curve as a Function of Wavelength for the PDQ30C Segmented Quadrant Position-Sensing Detector
Click to Enlarge
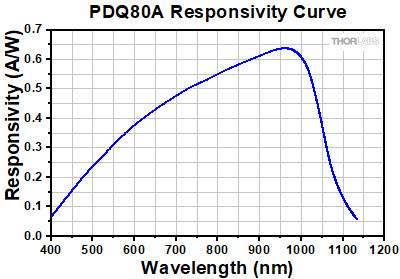
Responsivity Curve as a Function of Wavelength for the PDQ80A Segmented Quadrant Position-Sensing Detector
 Click to Enlarge
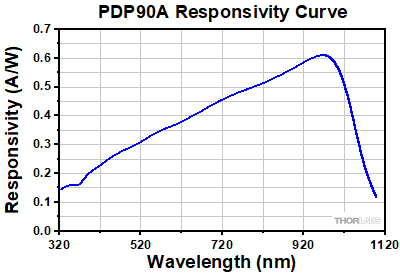
Responsivity Curve as a Function of Wavelength for the PDP90A Lateral Effect Position-Sensing Detector
2D Lateral Effect Position-Sensing Detectors
Overview
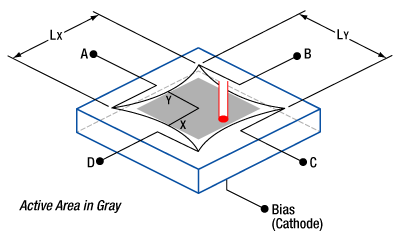
Figure 4.1 Lateral Effect Sensor Diagram
The 2D lateral effect sensor provides an accurate way to measure displacement - movements, distances, or angles – as well as feedback for alignment systems such as mirror control, microscope focusing, and fiber launch systems. These sensors work by proportionally distributing photocurrent using resistive elements to determine position and are usually referred to as lateral effect sensors. There are two different types of lateral effect sensors: duo lateral and tetra lateral.
Duo lateral sensors provide a resistive layer on both the anode and cathode photodiode connections. This isolates the x and y positional information of the sensor and allows the sensor to be highly linear and very accurate. However, the added resistive layers significantly increase manufacturing cost.
Tetra lateral sensors, such as the PDP90A, use a single resistive layer with a common cathode and an anode on each side of the detection area. This makes them very inexpensive to manufacture; however, the linearity decreases as the spot moves away from the center. This is caused by the physical location of the anodes along the sides of the sensor, specifically in the corners where the anodes approach each other. Thorlabs uses a variation of the tetra lateral sensor commonly called a “pin cushion” sensor, a diagram of which is shown in Figure 4.1. This sensor moves the anodes to the four corners of the sensors, reshaping the sensor area to produce linearity comparable to a duo lateral sensor at a significantly lower cost.
Calculating the Position
The PDP90A includes circuitry to decode the Δx, Δy, and SUM signals as follows:

From these formulas, the actual distances can be calculated with the following equations:

where x and y are the distances from the center of the sensor to the light beam's position, and Lx and Ly are the resistance lengths of the sensor. For the PDP90A sensor, Lx = Ly = 10 mm. Note that the resistance lengths are not the same as the active area. The active area is depicted by the gray region in Figure 4.1.
Positional Errors
Unlike quadrant style photodiodes, lateral effect sensors are independent of beam shape and size. They will provide positional information of the centroid of the spot as long as the light is located on the sensor. If part of the light moves off the sensor, it will cause a shift in the centroid, making the beam measurement unreliable.
Positional errors will also be caused by ambient light levels. For best results, the PDP90A should be operated in a dark location. However, light baffling using lens tubes and irises to narrow the field of view (FOV) will limit ambient light level errors.
Position Resolution
Position resolution is the minimum detectable displacement of a light spot incident on the position-sensing detector. Position resolution (ΔR) is a function of both the resistance length (Lx or Ly), or the x and y length, and the signal to noise ratio (S/N). The signal to noise ratio for this system can be defined as the SUM output signal level (Vo) divided by the output voltage noise (en). The PDP90A output noise is <2 mVpp, or <300 µVrms.

where,
ΔR is the resolution,
Lx is the resistance length,
en is the output noise voltage, and
Vo is the SUM output voltage level.
For the PDP90A:

For best results, Vo should be maximized to 4 V, resulting in a position resolution of 0.750 µm. To do this, monitor the SUM output voltage of the sensor and adjust the optical intensity until the output is approximately 4 V. Increasing above 4 V will saturate the system, causing unreliable readings. The provided operational software will indicate the voltage level on a slide bar. If the SUM is saturated, the slide bar color will turn red. Back off the intensity until it switches to green. This will be equivalent to a 4 V SUM output.
Segmented-Quadrant Position Sensing Detectors
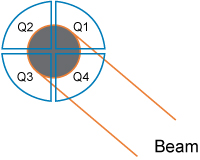
Figure 4.2 Segmented-Quadrant PSD Diagram
The segmented-quadrant position sensors consist of four distinct yet identical quadrant-shaped photodiodes that are separated by a ~0.1 mm gap and together form a circular detection area capable of providing a 2D measurement of the position of an incident beam. When light is incident on the sensor, a photocurrent is detected by each sector (labeled Q1, Q2, Q3, and Q4 as shown in Figure 4.2). From these signals, difference signals can be determined using an appropriate A/D converter. The sum of all four signals is also determined for normalization purposes. The normalized coordinates (X, Y) for the beam's location are given by the following equations.


If a symmetrical beam is centered on the sensor, four equal photocurrents will be detected, resulting in null difference signals. Therefore, the normalized coordinates will be (X, Y) = (0, 0). The photocurrents will change if the beam moves off center, thereby giving rise to difference signals that are related to the beam displacement from the center of the sensor.
These sensors are very accurate and are ideal for auto-alignment applications. However, care should be taken in the shape and density distribution of the incident beam because these detectors are sensitive to both parameters. A beam that does not have a Gaussian intensity distribution will be centered based on the power rather than the geometric center of the beam. For these types of beams, a lateral sensor might be better suited.
PDP90A Pin Diagrams
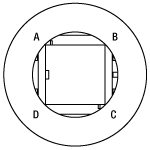
Photodiode Detail
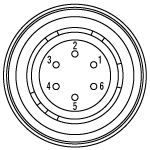
Female 6-Pin Hirose Connector, Detector Out
| Pin | Description |
|---|---|
| 1 | X-axis [A + D] - [B + C] |
| 2 | Y-axis [A + B] - [C + D] |
| 3 | SUM [A + B + C + D] |
| 4 | +Vsupply (+5 V) |
| 5 | Common |
| 6 | -Vsupply (-5 V) |
PDQ80A and PDQ30C Pin Diagrams
Photodiode Detail
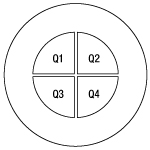
Female 6-Pin Hirose Connector, Detector Out
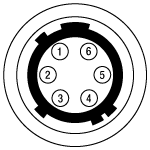
| Pin | Description | |
|---|---|---|
| 1 | X-axis [Q2 +Q3] - [Q1 + Q4] | |
| 2 | Y-axis [Q1+Q2] - [Q3 + Q4] | |
| 3 | SUM [Q1 +Q2 + Q3 + Q4] | |
| 4 | +5 V to +15 V | |
| 5 | Common | |
| 6 | -5 V to -15 V | |
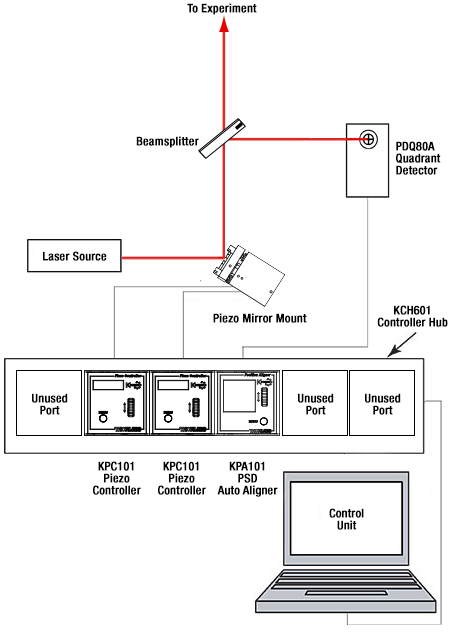
Figure 6.2 Typical Auto-Alignment Schematic
Example Auto-Alignment Setup
A basic auto-alignment schematic is shown in Figure 6.2. It consists of a PDQ80A Photodiode Sensor, a KPA101 Beam Position Aligner, two KPC101 Piezo Controller and Strain Gauge Readers, a previous-generation ASM003 two-axis piezo mirror mount (alternative mounts can be found here), a laser source, and a computer. Together, the system is used to position and maintain the laser beam so that it is located at the center of the detector array with respect to the beam's power density.
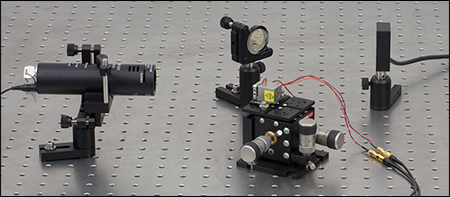
Click to Enlarge
Figure 6.1 Example Auto-Alignment Setup
The experimental setup shown in Figure 6.1 was created based on Figure 6.2. An LDM635 red laser diode module emitting at 635 nm serves as the laser source. The light is incident on a previous-generation ASM003 turning mirror mount, which is mounted on an MBT616D flexure stage (center of Figure 6.1). The turning mirror's X and Y motions are controlled using two KPC101 units (not shown). Please note that the piezo elements are meant for small beam alignment adjustments. The turning mirror directs light to a BP150 pellicle beamsplitter. The light transmitted by this beamsplitter will continue on to the rest of the experimental setup (not shown) while the reflected light is directed towards the PDQ80A Quadrant Sensor (right of Figure 6.1), which is controlled by the KPA101 Auto-Aligner (not shown).
When using a Quadrant Detector, choosing an appropriate alignment laser, such as the KLS635 or KLS1550, is essential. The laser's wavelength, beam diameter, and power all have a significant effect on the performance of the system. While there are countless sources that are suitable for use with our quadrant detectors, the lasers and optical components below have been selected for their cost-effectiveness and ease of use.
Photodiodes, such as those used in our quadrant detectors, should have less than 1 mW of incident light on them for linear responsivity. Beam splitters are commonly used in auto-alignment systems and reduce the amount of light on the detector. Depending on the optical setup, the laser's power may need to be further reduced, which can be accomplished using the power adjustment wheel on our K-Cube® lasers.
The suggested fiber patch cables are each 2 m long and are matched to the fiber type in the laser source. While we offer many different collimators, the ones suggested here are part of our Adjustable Collimator line and provide an appropriately sized beam diameter for use with our Quadrant Detectors. The collimators can be mounted numerous ways, but the VC1(/M) is a versatile solution suitable for most applications.
PDQ80A Compatible:- Wavelength Range: 400 - 1050 nm
- Input Beam Diameter: 1 - 3.9 mm
- Max Incident Power (for Linear Response): 1 mW
| Laser | Description | Power Supply | Fiber (2 m Length) | Collimator |
|---|---|---|---|---|
| KLS635 | 635 nm, 8.0 mW Fiber-Coupled K-Cube Laser | KPS201 | P1-630A-FC-2 | CFC11P-A |
PDQ30C Compatible:
- Wavelength Range: 1000 - 1700 nm
- Input Beam Diameter: 0.2 - 0.5 mm
- Max Incident Power (for Linear Response): 1 mW
| Laser | Description | Power Supply | Fiber (2 m Length) | Collimator |
|---|---|---|---|---|
| KLS1550 | 1550 nm, 7.0 mW Fiber-Coupled K-Cube Laser | KPS201 | P1-SMF28E-FC-2 | CFC2-C |
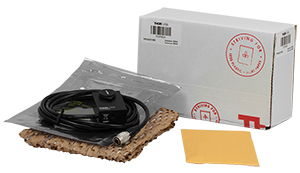
Click to Enlarge
Figure 8.2 PDP90A Packaging

Figure 8.1 Sustainability Stamp
In support of Thorlabs' company values, we are taking steps to implement more sustainable product packaging, including:
- Reducing the Weight of Packaging Materials
- Increasing the Usage of Recyclable Packing Materials
Thorlabs' sustainability initiative is aimed at waste minimization while still maintaining adequate protection for our products. By eliminating any unnecessary packaging, implementing packaging design changes, and utilizing eco-friendly packaging materials for our customers when possible, this initiative seeks to improve the environmental impact of our product packaging. Figure 8.2 demonstrates the use of recycled paper in place of plastic bubble wrap in this product line. For more information on our efforts toward a greener future, please visit our Sustainability page.
| Posted Comments: | |
Thomas Woods
(posted 2025-08-15 13:42:16.93) Could you share the schematic of the PDQ80A so we can change out the feedback resistors for the diode op amps so we can have large signal gain? If you can not share the schematic, could you at least let us know which resistors to replace for about a factor of 10 higher gain? From examinging the PDQ80A electronics board, it looks like the feedback resistors are the 10 kOhm resistors in the 4-resistor array called RA1. Thanks. tdevkota
(posted 2025-08-25 10:10:48.0) Thank you for contacting Thorlabs. Unfortunately, we cannot recommend or support modifications to this device. Any modification would also void the warranty. I have reached out to you directly with further details. Anton Ryzhov
(posted 2025-08-15 13:41:32.627) Will PDP90A work with a pulsed (rep. rate 50 kHz or higher) laser at 260 nm? tdevkota
(posted 2025-08-15 02:27:45.0) Thank you for contacting Thorlabs. The PDP90A position-sensing detector will not work at 260 nm. Since it is a Si-based detector, the responsivity is too low outside its specified wavelength range. wang jing
(posted 2025-02-20 16:44:54.99) 您好,请问有关于PDQ30C的使用手册或者产品的详细说明书吗?我们想买回来进行二次开发,这个产品能使用不同的光斑定位算法吗?谢谢! cdolbashian
(posted 2025-02-28 12:14:09.0) Thank you for reaching out to us with this inquiry regarding integration options of our position sensing devices. A member of the China technical support team will contact you directly. For future troubleshooting inquiries, please feel free to contact your local support office directly at techsupport-cn@thorlabs.com. Alican Kartal
(posted 2024-09-30 08:34:23.24) Hi,
We have this product in our lab and we need the software to use it. We would appreciate it if you could send it to us.
Thanks,
Alican jpolaris
(posted 2024-09-30 06:25:24.0) Thank you for contacting Thorlabs. I have reached out to you directly with the software for your PDQ80S1 position sensing system. Yui Taira
(posted 2024-08-05 18:06:54.707) I am using this product with KPA101. The software is APT™.
I have two questions.
Within a couple of days of starting the location measurements, the values have changed significantly. Are there any changes in measured values due to temperature?
When SUM is 10V (SUM is saturated and the slide bar is red), is there any effect on the location information? ksosnowski
(posted 2024-08-19 10:50:28.0) Hello Yui, thank you for reaching out to us. Temperature changes could cause some potential drift to the electrical center of the sensor. The exact thermal drift could vary slightly between different units. If alignment to a static central point is required, a quadrant sensor instead has central gaps which provide a static physical reference in the measurement. Thermal drift and hysteresis in optomechanical setups can also lead to potential alignment changes over time. Our Polaris series mounts are even designed to help eliminate thermal hysteresis for better long-term static alignment. 10V output will saturate the amplifiers in the PDP90A and leads to a loss in linearity of the measurement. I recommend reducing the laser power or using ND filters to attenuate the beam. A SUM voltage of 4V is recommended for optimal signal while preventing any saturation effects. changsheng li
(posted 2024-07-12 09:44:16.713) 咨询PDP90A产品符合性认证(产品合格证)证明和精度计量(质检报告)证明 cdolbashian
(posted 2024-06-04 01:59:15.0) Thank you for reaching out to us with this inquiry. For many of our photodiode detectors, we do not spec damage threshold, as they will saturate electrically far before they will be damaged optically. In this case the saturation power is a few mW (dependent on your wavelength), compared with 200mW you are using. Such information can be found in the spec sheet. I would not recommend using such a powerful optical source with this particular device. I have contacted you directly to inquire regarding your application and the necessity for such a high power source. user
(posted 2024-05-29 15:34:37.9) Dear Sir/Madam,
I purchased this item along with the KPA101 and I would like to know if it is possible to measure simultaneously the position of the laser beam and its optical power ? I assume this is feasible since the KPA101 provides the side bar to avoid saturating the amplifier. So could you please let me know what data I should use to access the measured power incident on the detector ?
Thank you very much in advance,
Flavien Beffara ksosnowski
(posted 2024-05-30 12:11:48.0) Hello, thanks for reaching out to Thorlabs. PDP90A has . The PDP90A's SUM voltage is a result of the total incident power on the sensor's active area and can be used as to estimate the total power in Watts using the specified transimpedance gain of 100 kV/A and peak responsivity of 0.6 A/W @ 960 nm. For other wavelengths, you can reference the typical spectral responsivity curve of PDP90A to account for the lower photocurrent response. We recommend keeping the SUM output at 4V to avoid saturation of the photodiode and amplifier in PDP90A, which could effect the measurements. Stefan Marchfelder
(posted 2023-12-19 09:14:21.903) Kann man das Kabel des PDP90A verlängern? Gibt es bei Ihnen ein entsprechendes Verlängerungskabel?
Vielen Dank. ksosnowski
(posted 2023-12-19 12:11:50.0) Thanks for reaching out to Thorlabs. We have offered specials with longer cables however our standard design and noise are based on the standard cable length. Longer cables may introduce additional environmental noise. We do offer HR10AD1 as a breakout cable with the same Hirose connector however we do not currently offer a direct extender cable for these position detectors. A member from your local tech support team has reached out to discuss this application further. Christian Knoechel
(posted 2022-10-12 13:49:18.937) Is there a way to change the gain of the sensor or to adjust something similiar to exposure time of a camera? ksosnowski
(posted 2022-10-20 09:50:05.0) Hello Christian, thanks for reaching out to Thorlabs. The PDP90A and our other position detectors are fixed gain units. You can use the SUM voltage to monitor the total power level, and Neutral Density filters as needed to attenuate the beam below saturation. We recommend operation below 4V SUM to avoid saturating the amplifier, and you can estimate the Sum voltage from your source using your input optical power with the PDP90A responsivity and gain. The PDP90A manual has more detail on this calculation on pages 4 and 5. Cole Perkins
(posted 2022-05-27 15:25:24.13) Hi, I am looking to purchase a PDP90A. I was curious if you had any recommendations for connecting the cable to a computer to read the output voltages. Also, once connected would the software provided display these outputs? Thank you. ksosnowski
(posted 2022-06-20 09:37:15.0) Thanks for reaching out to Thorlabs. I recommend the KPA101 PSD Auto-Aligner for connecting with the PDP90A, this will connect to the PC via USB and allow you to interface with our Kinesis Software to read the voltages from each pinout on the connector. You can also interface with various languages like LabView depending on what your application may require. It is also possible to run the PDP90A+KPA101 Headless, with no PC, using the display on the KCube to monitor the detector output. Some customers also choose to interface using a DAQ card to read the outputs. Minchul Kim
(posted 2022-04-28 10:42:11.58) Hello, I'm looking for 2D lateral effect PSD (NOT Quadrant PSD) for IR(1300~1600nm) wavelength range. Is it possible to order a custom-made product for such wavelength range? If it is possible, it would be grateful if you can send us a quote with estimated specs. cdolbashian
(posted 2022-05-02 01:40:06.0) Thank you for reaching out to us with this inquiry! Unfortunately, as you have pointed out, we do not have a device with this wavelength range. Implementing different electronic components into our current position sensor design would require substantial R&D to ensure high-quality performance. Due to this fact, we unfortunately cannot create a unique IR Lateral effect PSD for you at this time. Leon Lu
(posted 2021-07-11 02:29:35.28) Hi,
I'm wondering is the SUM output pin is a good measurement of the overall power on the entire sensor - in other words, if I can use the SUM signal as a normal photodiode like with the quadrant photodiode.
Thanks,
Leon cdolbashian
(posted 2021-08-19 04:31:23.0) Thank you for contacting us here at Thorlabs! Rather than the position formulas, you can indeed use the "SUM" as a traditional single photodiode measurement. I have emailed you directly to discuss this further! Tom Dzelzainis
(posted 2021-03-18 17:13:18.287) Hi,
Do you sell a power supply suitable for powering the PDP90A itself, i.e. a suitable +/- 5 V supply?
Many thanks,,
Tom. YLohia
(posted 2021-04-08 11:09:06.0) Hello Tom, we offer the KPA101 below, which is capable of powering up the PDP90A. Unfortunately, we don't sell a dedicated +/-5 V power supply for this at the moment. Thomas Dzelzainis
(posted 2021-02-02 13:49:45.78) Hi,
When I search for the compatible connector for the PDP90A, which is given in the manual as HR10A-7R-6S I find only panel mounting connectors. Would you be able to specify a compatible cable mounted connector?
Many thanks,
Tom. asundararaj
(posted 2021-02-08 11:15:34.0) Thank you for contacting Thorlabs. The HR10A-7R-6S panel mounted connector can also be used in a cable mounted configuration as used in our TLK-10. Hirose offers the HR10A-7P-6S that can also be used for a cable mounted application. That being said, we would recommend confirming with Hirose on its compatibility for your application. kiwook baeck
(posted 2020-12-14 20:24:19.927) Hi, I want to use PDQ or PDP on linux board(RPi or LttPd). Do you have any recommendation? asundararaj
(posted 2020-12-24 10:17:58.0) Thank you for contacting Thorlabs. The position sensing detectors were designed to be used with the KPA101. We do not have any recommendations on using this with a linux board. Wolfgang Bacsa
(posted 2020-09-17 11:44:03.703) Hi, The x and y displacement works well but for optimizing the laser beam (PDP90A), the information of the intensity measurement would be very useful. There is a display of the total light intensity falling on the detector on the K-cube controller. Is there any way to access this information? asundararaj
(posted 2020-09-17 04:33:52.0) Thank you for contacting Thorlabs. The total intensity is defined as the SUM and is used to estimate the position of the beam on the sensor. This can be accessed through the SMA port marked SUM on the KPA101. This can also be accessed on the provided operational software as the voltage level on a slide bar. If the SUM is saturated the slide bar color will turn red. M Sz
(posted 2020-07-31 10:07:17.823) to Charles:user from the previous post. I have made some requests to Thorlabs technical support,got some answers email but non of them regarding this issue. How can I get your dlls and ActiveX components? DJayasuriya
(posted 2020-08-03 09:39:12.0) Thank you for getting in touch. My colleague will get in touch with you directly to resolve your issue. user
(posted 2020-07-23 16:28:52.513) Hi,
I am going to use PDP90A with KPA101 ( but without KPZ Piezo Drivers) to calibrate the piezo fiber scanner ( I think I just need to monitor the fiber tip movement without using any loop). Data that I need to obtain from calibration are:
-sensor signal vs time for X, Y, and sum
-position X vs position Y
- fiber displacement vs frequency.
Can your APT/Kinesis software be able to produce data like that or if not how can I generate such results?
Thank you,
Regards,
M. cwright
(posted 2020-07-29 05:36:59.0) Response from Charles at Thorlabs: thank you for contacting us. This is not a feature which is provided in APT or Kinesis directly but the functionality is offered by our dlls and ActiveX components. Your local support team has reached out to you about how this can be achieved using the libraries provided with our software. user
(posted 2020-03-06 09:28:21.017) Hi, I am considering using your PDP90A sensor in an application where the optical power incident upon the sensor is limited. The exact value is not known yet, but it may be in the region of 1 µW to 10 µW at a wavelength of 900 nm, which is less than the recommended value indicated by the blue curve on the graph titled "PDP90A Wavelength Dependence on Optical Power With Operating Power Range". What would be the consequences of operating below the recommended power level? Would there simply be increased uncertainty on the measured position, or are there other consequences? YLohia
(posted 2020-03-19 12:34:42.0) Hello, thank you for contacting Thorlabs. This graph was generated based on the operating parameters. The "Max Optical Power" curve was based on the max output voltage capability, the photodiode amplifier gain, and the responsivity of the sensor. This is essentially the saturation point of the PDP90A for a given wavelength. The "Min Optical Power" curve was generated for a 16-bit input DAC that was originally sold with these a while ago. The curve was based on the number of counts needed to maintain a 1% error. Going below that curve would lower the accuracy of the measurement. Depending on what you are measuring the signal from the PDP90A with, the sensor output voltage may be too low to accurately measure the position. This is more of a function of the available gain in the PDA90A. You may be able to amplify the output before measuring to correct for this. user
(posted 2020-01-27 21:47:17.69) What laser modules are recommended for use with PDP90A? Can the output power for LDM635 be adjusted low enough to avoid exceeding the 40 uA max allowable photocurrent? asundararaj
(posted 2020-01-28 01:50:49.0) Thank you for contacting Thorlabs. The LDM635 has a 4 mW power specification at 635 nm. The responsivity of the sensor in the PDP90A is approximately 0.4 A/W at 635 nm, so an incident beam of 100 µW would saturate the sensor.
Reducing the output power to 2% would keep you safely within the recommended region suggested on the overview page for this product at 80 µW. The LDM635 can be adjusted via a recessed screw on the laser but you need to use a power meter to determine the power as it is adjusted. Alternatively you can use ND filters with an OD of at least 1.7 to achieve this. Vignesh Kannan
(posted 2020-01-16 12:21:49.857) We seem to have an issue with the PDP90A. I noticed that the sensitivity in output signal for the X-channel i.e. pin 1 was significantly smaller than for pin2 (Y-channel). The \SUM channel was set at ~ 4V. In addition, when the incident laser beam was turned off, the X-channel had a value of -1 V and not 0 as expected. Could someone help me troubleshoot this problem please? asundararaj
(posted 2020-01-17 09:25:41.0) Thank you for contacting Thorlabs. We will reach out to you directly via email. Jr-Rung Chen
(posted 2020-01-07 19:29:32.057) We have the PDQ80A and KPA101. We try to use the postion signals which is from Sum, X Diff and Y Diff in KPA101. We found that the SUM has voltage from 0-10 V but others are always zero. Are thry need to set ? asundararaj
(posted 2020-01-08 11:19:00.0) Thank you for contacting Thorlabs. The signal on the X DIFF and Y DIFF terminals depend on the operating mode selected. This is elaborated in Section 4.5 of the Manual. The SUM signal from the detector is always present on the rear panel SUM SMA connector irrespective of the operating mode selected. The SUM is proportional to the total amount of light hitting the detector. In the open loop mode, the X DIFF and the Y DIFF outputs are set to zero, or are held at their last closed loop voltage (depending on the setting of the 'Position Demand In Open Loop Mode' parameter in the Settings panel).To be able to monitor the signal, please select Monitor Mode. Aleksei Polukhin
(posted 2019-12-19 02:47:35.327) Hello. Early you mentioned that for PDP90A maximum output current is 40 μA and for a 532 nm beam maximum optical power is about 0.1 mW.
But in the detector's User Guide (Rev J, August 20, 2019) mentioned that max photocurrent is 500 μA (p. 5). Using photosensitivity curve I got for 532 nm beam next calculation of max optical power:
P_max = 500 μA / [0.33 A/W] = 1515 μW = 1.515 mW.
Is it right calculation? asundararaj
(posted 2019-12-20 11:10:38.0) Thank you for contacting Thorlabs. The saturation current for the PDP90A should be closer to 40 µA instead of 500 µA. The max output voltage is 4V with gain of 100kV/A. So to avoid saturation of the amplifier, the photocurrent needs to be lower than 40 µA. We are currently working to update the Specs tab as well as the Manual. Rui Zhang
(posted 2019-12-16 04:03:44.237) I would like to ask if this position sensor is available to pulsed laser too?
For example 1~50 Hz YLohia
(posted 2019-12-16 01:22:11.0) Thank you for contacting Thorlabs. The PDP90A is specified for a 15 kHz bandwidth. It can detect 1-50 Hz pulses. Jan Vlacil
(posted 2019-09-16 05:22:26.49) Hello, we are currently using the PDP90A Sensors in our custom measurement system. Is there any need to recalibrate the system after some period of time? For how long can the sensors maintain its accuracy? Thank you for your help. asundararaj
(posted 2019-10-22 04:32:31.0) Thank you for contacting Thorlabs. We do not offer recalibration services for the PDP90A as they are intended for relative position measurement and not absolute measurements. The sensor and position accuracy are tied to temperature so there can be a drift naturally just from environmental changes. I have contacted you directly to discuss this further. Vignesh Kannan
(posted 2019-08-14 10:05:47.407) Hello. We are interested in using the PDP90A without the K-cube using a custom measurement system.
Is there a special cable that I can use to connect the Hirose connector to coaxial inputs or would I have to re-wire the cables myself?
Also, if I would like to perform a manual calibration of the zero-position of the sensor, can I simply use my laser's kinematic mounts to get the x and y signals to zero?
Thank you. YLohia
(posted 2019-08-16 09:03:56.0) Hello, thank you for contacting Thorlabs. Unfortunately, we don't have a special cable for third party read-out systems, so you would have to wire the connections yourself. Assuming you are asking whether you can use your kinematic mount to move the laser spot to the true "zero" position of the PDP90A, the answer is yes. Woojin Choi
(posted 2019-06-04 06:45:37.763) In your comment below, you referred that the bandwidth meant the sampling rate of the detector. I heard that KPA101 is needed to get the position data from PDP90A. I am wondering the maximum number of the position data per second when I use KPA101 and PDP90A. rmiron
(posted 2019-06-05 11:17:24.0) Response from Radu at Thorlabs: The specification you are looking for is the sampling rate of KPA101s analogue to digital converter, which is 20 kHz. Woojin Choi
(posted 2019-03-29 01:06:17.09) I am considering to buy PDP90A. I have a question about the specification of PDP90A. What is the meaning of bandwidth in the specification? Does this mean the sampling rate per second? YLohia
(posted 2019-03-29 09:32:08.0) Hello, yes, you are correct. The "bandwidth" in this case refers to the sampling rate of the detector. tuomo.nupponen
(posted 2019-02-13 16:45:53.04) Hi,
Looking for very precise xy-position sensor to be used with my Polytec PL650 W HeNe laser connected to Leica T3000 0,5" high precision alignment theodolite.
Laser Unit: Polytec PL-650 W
-Wavelength: 632,8 nm
-Output Power: 3 mW
-Effective Output Power from telescope: 0,1 mW
-Polarization: Random
-Amplitude Stability: +/- 2% (short term)
-Beam diameter with theodolite optics:
at 10 m 0,5 mm
at 50 m 2,5 mm
at 100 m 5 mm
at 200 m 10 mm
at 300 m 15 mm
What would be your recommendation: Can Lateral Effect Position Sensor be successfully used, or are Quadrant Position Detectors better choice? YLohia
(posted 2019-04-05 11:36:53.0) Hello, thank you for contacting Thorlabs. Is your beam circular and Gaussian? At what specific distance are you hoping to measure the beam position? We would also need to know the diameter of the beam at the point where you plan on placing the position sensor. I had reached out to you directly at the time of this posting to gather these details. al12179
(posted 2019-02-01 16:48:12.26) I need to use a Silicon quadrant detector, and you recommend a spot size above 1 mm, but I need to put this detector in the focal plane of my telescope. How can I get such a big spot size in the focal plane? According to my current asumption, the focal plane will have a spot diagram around 20 um. Thank you! llamb
(posted 2019-04-05 02:43:07.0) Thank you for your feedback. The silicon quadrant detector will have errors introduced if you reduce the spot size below Ø1 mm in diameter. To work around this, you could consider using a beamsplitter prior to your focal plane to monitor the position of this split-off beam with a larger spot size at a different location. This way could still allow you to track small movements of your beam. I reached out to you by email on February 4th to discuss more details about your application. steve
(posted 2018-12-05 15:03:06.257) Is data available for XDIFF output voltage vs. beam position on the the PDP90A position sensor so its linearity can be examined? The manual cautions to stay within the inner 80% area for best results. Is that due to linearity concerns or noise? I have noticed large increase in XDIFF and SUM output voltage noise when a beam gets closer to the sensor edge. How linear then is it within the 80% region? Suggest using a laser pointer perhaps with iris and mechanical translation stage to step across the sensor (10 micron increments ?) and record XDIFF output voltage. Do this across the horizontal center YDIFF=0 line. Suggest mentioning in the manual that noise increases near the sensor edge. YLohia
(posted 2018-12-24 09:59:09.0) Hello, thank you for contacting Thorlabs. It appears that you are already in contact with us via email -- we will continue to troubleshoot this issue there. Please note that the linearity data is not available. That being said, we can provide 10 lot sampling data for reference. volker
(posted 2018-11-12 01:13:44.85) We use the lateral sensor together with KPA101 with
a pulsed laser with a repetition rate of 10kHz. When using the APT software the SUM signal fluctuates wildy from close to 0 up to oversaturated. I believe this is due to some sampling issue (e.g the software sampling rate not being in sync with the repetition rate of the laser. Is there a way to trigger the acquisition or to reduce the bandwidth of the detector, e.g low-pass filtering?
The outputs of the KPA101 (diffx, diffy and sum) look to be a series of pulses with long tails, but the APT software may sample the pulses at varying time positions, causing the issue. Is there a way to use/modify the APT software or some labview library to allow measurements of pulsed lasers more smoothly. The detector seems to work easily with cw laser. rmiron
(posted 2018-11-12 11:25:28.0) Response from Radu at Thorlabs: In theory, one can synchronise the detector's sampling to the laser's pulses by using the trigger port and sending signals accordingly. However, it would be much easier to attempt amending the problem by adjusting the low-pass filter. You can tune its frequency from Kinesis, if you access the device's settings. You can also set the operating mode of the trigger port from the same location. Unfortunately, you cannot adjust those settings without connecting KPA101 to a PC. robertmeissner
(posted 2018-10-16 06:50:24.703) Is there a way to extract the voltage of all four quadrants separately? Your cubes and connectors only provide the X and Y signals, not the respective voltages. rmiron
(posted 2018-10-19 10:21:49.0) Response from Radu at Thorlabs: Hello, Robert. Unfortunately, this is not possible. As you can see in the pin diagram tab, the detector only outputs the XDIFF, YDIFF & SUM readings. Furthermore, you cannot derive the readings for each quadrant from these values, because if you attempt to do so, you would have 3 independent equations and 4 unknowns. Therefore, a change of hardware would be required in order to enable users to obtain those values. If you write to us here, or at europe@thorlabs.com and describe some of the benefits that such a feature would bring, we will relay your feedback to the relevant engineers. 1208084305
(posted 2018-10-09 10:57:22.937) We have bought your company's PDP90A, and then we would like to use it to measure the moving distance of the spot, but will not operate, I would like to ask the specific how to set up the experiment and then how to operate it, can you give a specific explanation? YLohia
(posted 2018-10-10 10:05:24.0) Hello, thank you for contacting Thorlabs. Based on our discussion, the TPA101 that you are using with your PDP90A is actually working fine and outputting the offset voltages. These voltages can be converted to actual positions (in mm) by utilizing the equations given under the "Tech Info" tab of this page. You can then use one of our supported programming languages such as LabVIEW to keep track of the absolute position in the x and y coordinates to obtain the distance traveled from Point A to Point B within a particular time interval. Specific operating instructions can be found in the manual for the TPA101. Franckyboy.morin
(posted 2018-08-27 17:02:01.483) I would like to use this laser position sensor in an industrial application for machine flatness adjustment. The laser I intend to use Is a construction work leveling laser. See Leica rugby 840. It offers the rotary laser configuration as well as the straight beam configuration. The laser shoots in the 635nm wavelength and has an output power of 2.7 mW. The beam divergence is less than 1.5 mrad. I plan to use the sensor indoor with the lights on.
Along with the sensor, I plan to buy a tube to fit the aperture, 3" long, with a laser line filter for 635nm. This is to reduce noise caused by ambiant light.
I calculated the maximum optical power permissible for this wavelength to be 0.1 mW. Is this correct? Will I break the sensor if I go beyond that? To reduce the input power, I plan to use one of your ND absorption filters with AR coating. I plan to fit it behind the laser line filter.
Since it is my first time with that kind of technology, I would like to know if you have food for thoughts to send my way? Anything I forgot or did not consider right? llamb
(posted 2018-09-14 02:33:54.0) Thank you for contacting Thorlabs. You are correct that the maximum optical power at 635 nm is about 0.1 mW. Going much higher would begin to saturate the sensor. The sensor will saturate at a much lower power density than its damage threshold, so if saturation is noticed and the maximum optical power is exceeded, make sure to refrain from increasing the power any further to avoid risk of damage. ND filters are indeed useful if your beam power is normally 2.7 mW. heidi.cattaneo
(posted 2018-06-19 11:16:29.707) I would like to know the noise and position resolution of PDQ80A.
Kind regards,
Heidi Cattaneo YLohia
(posted 2018-06-19 10:15:34.0) Hello Heidi, thank you for contacting Thorlabs. At the moment, unfortunately, our engineers have not measured the voltage noise for these detectors or the NEP of the photodiode. You can roughly estimate your signal to noise ratio for a CW source using the responsivity of your source/dark current value multiplied by the transimpedance gain. The resolution of the detector depends on the controller or the analog to digital conversion and the noise in the electronics. Please note that we do not recommend to use this detector for applications in nanometer range, if that is what your application needs. The PDQ80A is made up of four different sensors with a 42µm gap between them. Specifying a resolution becomes tricky due to that gap. creative.query123
(posted 2018-06-13 04:12:53.377) Hi,
I wonder how can we divide the x and y voltage output of sensor by sum output voltage of sensor, as all of sensor outputs will have some noise in it and dividing the two output also divides the noise (x and sum) in it and resultant can be more noisy. Even after filtering, some residual noise may remain, so how can we divide such two quantity and get precise angle? YLohia
(posted 2018-06-14 04:49:14.0) Hello, you are correct about all channels having some noise. That being said, the noise comes from the same detector/amplifier so it will actually get smaller (since the noise is the same across channels). Another thing to note is that the detector itself is photovoltaic, which means less inherent noise. We also have a spec for voltage noise, which is <2 mVpp or <300 µVrms for the 15kHz bandwidth of the detector. Unfortunately, we don't have any suggestions for reducing the little noise that remains. user
(posted 2018-05-16 15:16:51.847) Hi, I'm using the PDP90A and would need to know the relationship between the DIFF output voltage and the absolute value of the beam position. Using your formula I get that 1mV corresponds to 1.25um when operating close to saturation, i.e. SUM ~ 4V, is this correct? Many thanks in advance! bhallewell
(posted 2018-05-22 06:37:04.0) Response from Ben at Thorlabs: You can find the calculations within the 'Calculating Position' section of the 'Tech Info' tab. This is correct - to within the calculated Position Resolution error value. h.wu
(posted 2018-04-30 09:21:52.04) I would like to know which PDAs can provide the absolute value of beam displacement? PDP90A or PDQ80A? Thanks. YLohia
(posted 2018-04-30 09:22:04.0) Hello, thank you for contacting Thorlabs. Both the PDP90A and PDQ80A can provide this information. The PDQ80A, however, is only useful when the beam displacement is less than the radius of the beam and requires the beam to have some component present in all four quadrants. Thus, it seems that PDP90A may be better for your application. a.randall
(posted 2018-04-18 08:11:56.243) Found this when looking for something to help with alignment of my microscope- realized a version that had a matched SM thread on the back (aligned to the one on the front would be very useful so the device to could be attached to the input of a downstream device YLohia
(posted 2018-04-18 09:31:12.0) Hello, thank you for your feedback. We would be a little wary of adding a matched SM thread on the back since that would only negatively impact the tolerance stack of a system that is required to have very precise alignment. I will contact you directly to find out about your application and brainstorm other ideas to mount your position sensing detector to your setup. amar230292
(posted 2018-04-11 23:04:34.963) What is the output impedance of sum,x and y pins of PDP90A? I want to read these value through ADC.
Thanks in advance. YLohia
(posted 2018-05-02 09:09:26.0) Hello, thank you for contacting Thorlabs. The output is driven directly by a Texas Instruments TL074BCD op-amp in the circuit. Op-amp output impedance is typically very low (ideally zero). Unfortunately, this component does not have an output impedance spec from the manufacturer. craig
(posted 2018-02-12 14:40:48.453) Hi. I just received a PDP90A lateral effect detector. I wanted to offer some feedback that I would have preferred that you sold it more ready to use out of the box. Specifically, I'd have preferred if I could have bought it with a power supply and it had two outputs X axis and Y axis. Second best would be if you included or at least sold the mating connector. What I didn't like is opening up the box and seeing I need to order a mating connector from Hirose or cut off the connector that was included. Thanks for listening! YLohia
(posted 2018-04-03 03:34:58.0) Hello, thank you for your feedback. We currently offer the KPA101 K-Cube Position Sensing Detector Auto Aligner for the PDP90A, which decodes the X and Y position signals and offers powerful auto-alignment features. The Hirose cable can directly plug into this without the need for any cable cutting. We currently have the ability to offer a female Hirose to male lead wires cable as a special, which sounds like the item you need. I will reach out to you directly about offering this item. f.bonetti
(posted 2017-12-22 08:50:14.637) Hi, I'm Francesco, I work at Euro.Soft, an Italian company.
I would need technical support on the use of some of your products (Quadrantal PDQ80A, LaserSource_CPS635R and KPA101) we bought to detect translations along x and y axis. Is it possible to talk to someone who can help me?
Best regards,
Francesco tfrisch
(posted 2017-12-27 03:42:06.0) Hello, thank you for contacting Thorlabs. We can help you with your application, yes. A representative will reach out to you directly. oleg.ermak
(posted 2017-10-25 22:41:11.17) We have 0.5 ns pulsed laser (green 532nm wavelength) with 30-micron spot size. What is the damage threshold of PDP90A in Watt per cm^2 and what will be expected position error for 30-micron spot size? tfrisch
(posted 2017-12-19 01:36:30.0) Hello, thank you for contacting Thorlabs. First, I want to point out that the spot size should be 200um or greater when using PDP90A. Secondly, the limit would be detector saturation before damage, and that would scale with the absolute power rather than the power density assuming the beam is larger than 200um. For a 532nm beam, the maximum output current of 40uA would be reached by about 0.1mW of optical power. The peak and average power should obey this limit. I will reach out to you directly to discuss the details of your application. bluehwale
(posted 2017-07-18 15:15:43.35) To whom it may concern
Hi
This is JinjuPark
I'm a user of products of PDA80A, KPA101.
They're working perfectly but I'm wondering the absolute value of displacement when the beam is moving.
I'm using APT program to see the position difference more accurately but this program also does not indicate the Absolute displacement length.
So I hope you to let me know that absolute length of 1 tick on PSD APT program.
Thank you. tfrisch
(posted 2017-08-11 10:59:41.0) Hello, thank you for contacting Thorlabs. Unlike a lateral effect sensor, a quadrant detector cannot give the absolute position. The signal from each of the 4 diodes is dependent on beam size, shape, and power distribution. The most common application is to monitor whether the beam position is changing in beam steering applications. I will reach out to you directly to discuss this further. julien.gamet
(posted 2017-05-15 13:02:05.04) Hi, I need to detect a beam position which moves at ~17kHz (sine). Is this PSD able to track such a signal? Thanks bwood
(posted 2017-05-16 09:32:16.0) Response from Ben at Thorlabs: Thank you for your feedback. This position measurement is governed by the bandwidth of the device. Unfortunately, for this sensor this is 15kHz, so the sensor will not be suitable for your application. Our full definition of the bandwidth specification is thus: "“The bandwidth is specified as the frequency at which the response of the sensor decreases to 3 dB below the low frequency (DC) response.
In more detail: let’s assume you set up a laser beam to sweep back and forth across the sensor, following a sinusoidal waveform. (To keep the example simple, let’s assume this sweep only takes place in one dimension, although the overall behaviour would be the same if we used an X-Y waveform.) So mathematically the X position of the beam can be described as:
X(t) = X0 * sin(2 * PI * f * t)
Where X0 is the amplitude of the signal and f is the frequency.
Now if you look at the XDIFF output of the PDP90A, you will see that it follows the position of the laser beam, so
XDIFF(t) = A * sin(2 * PI * f * t)
However, if you increase the frequency, you will see that the amplitude (A) of the response decreases with frequency. The sensor will be less and less able to keep up with the change in position and this will manifest itself as decreasing amplitude. At some frequency the amplitude will be 3 dB below the low frequency value (3 dB is about 71%) and that’s how we define the bandwidth. For the PDP90A this happens at 15 kHz.” rob.hornby
(posted 2017-04-24 16:44:49.073) Are there any recommended power supplies I could use without connecting via a T-cube or K-cube? We wish to probe the output voltages directly with a custom system but haven't found a separate power supply as straightforward as the K-cube's power supply yet. bhallewell
(posted 2017-04-26 11:02:14.0) Response from Ben at Thorlabs: We currently don't offer a power supply which can be used as standalone with the detector. We can only recommend use of the KPA101 at this time. al
(posted 2017-04-20 09:12:20.34) Hi,
Could you provide the specifications for 2D Lateral Effect Position Sensor at 1550nm?
Thanks and Regards,
Andrew tfrisch
(posted 2017-04-28 05:28:17.0) Hello, thank you for contacting Thorlabs. PDP90A uses a Si detector and will therefore be unsuitable for use at 1550nm. I will reach out to you directly about your application. albert.romann
(posted 2017-04-06 11:14:40.583) Is it still usable at 260nm? With what responsivity? jlow
(posted 2017-04-17 11:44:25.0) Response from Jeremy at Thorlabs: These detectors are not usable at 260nm. dirk.lorenser
(posted 2017-03-17 13:22:54.28) Can you please tell me the rise time (step response) for the lateral effect position sensor. From the 15kHz bandwidth I estimate a rise time of about 23 microseconds, but I need you to confirm that before I can purchase this product.
Thank you,
Dirk tfrisch
(posted 2017-03-23 11:59:02.0) Hello Dirk, thank you for contacting Thorlabs. Yes, the typical rise time would be 2.3 x10⁻⁵ seconds, 23us. dkleckner
(posted 2017-02-16 19:11:14.01) Are there any specifications on the noise performance on the quadrant photodiode? Should I expect it to be shot noise limited above some power level, and if so what is that power level? jlow
(posted 2017-03-08 02:37:55.0) Response from Jeremy at Thorlabs: This will depend on how you implement these in your system. We will contact you directly to provide more information. rchatre
(posted 2016-09-22 11:34:25.773) I'm very interested in knowing more on this product as I think it could solve one problem I have for a new medical device development (new project)
Regards jlow
(posted 2016-09-23 01:53:05.0) Response from Jeremy at Thorlabs: We will contact directly to discuss about your application. ysu
(posted 2016-05-13 19:22:08.52) Hello!
I use the PSD in the monitor mode. However I cannot find out how to save the measured voltage data in the APT software. Dose it have this function? bwood
(posted 2016-05-17 06:35:07.0) Response from Ben at Thorlabs: Thank you for your feedback. Unfortunately, APT does not have any data logging capabilities with the TPA101. However, data logging can be achieved in conjunction with certain third party software packages, like Matlab or LabView. I will be in direct contact with you with more information on how to do this. reemrafik
(posted 2016-05-04 16:01:21.48) Hi, I need to measure the position where the laser strikes after it is reflected off of a curved surface. So,is there a way to connect a focusing lens to the sensor?
Thank you besembeson
(posted 2016-05-05 10:48:30.0) Response from Bweh at Thorlabs USA: The detector has an SM05 internal thread so you can use our half inch lens tubes with external threads (SM05L05 for example: http://www.thorlabs.com/newgrouppage9.cfm?objectgroup_id=3306) to connect to the unit. These lens tubes can accommodate half inch diameter lenses. pauline.belzanne
(posted 2016-05-04 09:31:51.54) Hey,
I have a PDP90A with a TQD001 and I want to know the conversion between the voltage and the displacement?
For example, if XDIFF= 100 mV and become XDIFF=200 mV, what is the value of the displacement of the beam on the PSD?
Thanks msoulby
(posted 2016-05-05 07:00:33.0) Response from Mike at Thorlabs: The formula to calculate the position based on the X(DIFF), Y(DIFF) and SUM signals is available on our website. Please select the 'Tech Info' tab on this page for full details. ysu
(posted 2016-03-07 17:45:05.36) If I change the GUI Grid Display to 'normalized to sum signal' on computer when the controller is connected by USB, will the x, y output from the SMA be normalized as well? If not, how can I get the normalized signals? cevered
(posted 2016-03-10 12:14:16.0) Thank you for your question. We will contact you directly with more information about the SMA outputs of our TPA101. user
(posted 2016-01-22 08:19:37.257) We only want to use the Position Sensing Detector to measure the position, but we don't need the auto alignment. Is the controller necessary? jlow
(posted 2016-01-22 01:43:11.0) Response from Jeremy at Thorlabs: The TPA101 is used to provide the necessary drive voltage and also route the voltage signal for the SUM, X, and Y to the SMA outputs on the back. If you do not use the TPA101, you can get the TC200CAB10 cable, cut off one end of the connector, and wire in your drive voltage and your voltage probes yourself. john.harchanko
(posted 2015-04-02 10:13:51.85) We have the PDP90A connected to the TPA101 and illuminate the PDP90A with a laser beam. The software does not display the numerical X-Y position of the beam! It only displays a graphical representation. I see one other poster having the same problem from a couple of years ago. Is there a solution? msoulby
(posted 2015-04-08 08:15:49.0) Response from Mike at Thorlabs: Quadrant detectors are used primarily for beam alignment whereas lateral effect sensors are normally used for position measurement. However, the TPA101 can be used with either type of sensor for both auto-alignment and position measurement. Both types of sensor output three voltages (XDiff, YDiff and SUM) that are proportional to the position of the beam and the total optical power, however, lateral effect sensors like the PDP90A have a defined accurate relationship between these three voltages. Furthermore, if the user selects the PDP90A sensor type in the settings panel in the APT USER software the displays shows the XPos and YPos values in millimeters, whereas if the PDQ80A or PDQ30C sensor type is selected, the display shows the XDiff and YDiff values that the sensor outputs in Volts. The TPA101 always reads the voltages, but additionally for the PDP90A sensor, it is capable of calculating the exact X, Y position from these voltages. harkeman
(posted 2015-02-12 13:35:57.113) Hello, I am interested in using this sensor for pointing stabilization for a ~40 fs, 780nm pulse with a 1 kHz rep rate. Would this detector give a continuous signal for the beam position, or would it be choppy because of how short the pulse is? jlow
(posted 2015-02-24 04:17:56.0) Response from Jeremy at Thorlabs: The detector should be able to differentiate between each pulse because of the rep. rate relatively low so it won't be a continuous signal. I will contact you directly to discuss about your application. suntaree
(posted 2015-01-29 21:15:47.02) Please advise part number : PDP90A product made in country ?????
Suntaree Yuenyongwattanakorn
Inhouse Sales Section Head
Globaltronic Intertrade Co., Ltd.
634/2 Soi Ramkhamhaeng 39 (Thepleela1), Wangthonglang, Bangkok 10310, Thailand
HP : 08-5480-1464
TEL : 0-2530-9099 (Auto), 0-2935-6799 (Auto) ext. 213
FAX : 0-2935-6790,0-2530-9077
www.gti.co.th jlow
(posted 2015-01-30 04:54:10.0) Response from Jeremy at Thorlabs: The PDP90A is assembled in USA. bender
(posted 2014-05-28 13:22:42.24) I see in some past comments that other customers were interested in accessing signals from the detector without the controller. I'm interested in the PDP90A - could you give recommendations on what input impedance I should have to read signals from the PDP90A in the absence of a TPA101 controller? Thanks. besembeson
(posted 2014-06-03 02:33:51.0) A response from Bweh at Thorlabs in Newton-USA: Thanks for contacting Thorlabs. The recommended impedance is >=10kohm. paul.taylor
(posted 2013-08-18 09:47:18.603) I'd like to use the PDP90A with a 1 Watt Q-switched 355 nm laser with 30 microJoule per pulse and a rep rate of 30 kHz. Is there an issue of using the detector with a pulsed laser or does it just average? I would like to monitor the position of the beam after going through a lens. I will place the sensor after the beam has gone through focus - so the spot size can be set to optimum - but the beam will not be collimated - is that an issue?
Thanks jlow
(posted 2013-09-17 15:18:00.0) Response from Jeremy at Thorlabs: A 1W laser would be too powerful for the PDP90A and you can damage the detector. Typically if the repetition rate of your source is a lot higher than the bandwidth of the detector (15kHz in the case of PDP90A), then the detector would just average out the signal and it should still be able to give you the position information. We will contact you directly to discuss about this further. jericho163
(posted 2013-08-05 23:11:35.067) PDP90A
Recommended spot size 0.2mm-7mm.
Can I use a smaller spot size? Is there any issue? pbui
(posted 2013-08-08 14:55:00.0) Response from Phong at Thorlabs: We recommend using a spot size > 0.2 mm, since a smaller spot size could increase the the position detection error. user
(posted 2013-07-10 14:14:50.71) What is the typical rise time for this detector? tcohen
(posted 2013-07-16 20:04:00.0) Response from Tim at Thorlabs: The rise time is ~2.3*10^-5 seconds. patrick.lu
(posted 2013-03-07 21:27:29.993) Is there a way to read a physical position using this detector? We just purchased it, but it looks like the provided software only gives a voltage differential when we illuminate the detector with a laser. It is important for our application that we be able to measure the x-y coordinates of the beam. jlow
(posted 2013-03-12 12:59:00.0) Response from Jeremy at Thorlabs: You could use the PDP90A to read the position. This information can be found under the "Tech Info" tab on the PDP90A page (http://thorlabs.com/NewGroupPage9.cfm?ObjectGroup_ID=4400&pn=PDP90A). ansonwu0225
(posted 2012-02-22 22:49:27.0) Can TQD001 output signal (LV OUT XDIFF\YDIFF \SUM) receive by NI DAQ card (Analog receiver) without any software? tcohen
(posted 2012-02-24 10:33:00.0) Response from Tim at Thorlabs: The output signal can be recorded with a NI DAQ card. You will need some software for controlling the card, but you will not need any software from us. If you have any further questions, you can contact us directly at techsupport@thorlabs.com. ansonwu0225
(posted 2012-02-21 04:32:37.0) Is there any Versatile Software Package (Splicco) and Drivet Package (""""For LabVIEW"""") tcohen
(posted 2012-02-21 16:30:00.0) Response from Tim at Thorlabs: When used with the TQD001 control module the position sensing detectors can be run with our APT software. By clicking on the red page icon next to the TQD001 product number, you can view the manual which has information on the software and the methods for use with LabVIEW. You can also view the manual at http://www.thorlabs.us/Thorcat/17800/17869-D01.pdf. The SPLICCO software, our standard software package for spectrometers and line cameras, is not needed for use with the position sensing detectors. The SPLICCO software is located at http://www.thorlabs.us/software_pages/ViewSoftwarePage.cfm?Code=SPLICCO and the APT software for use with the TQD001 and our position sensing detectors can be located at http://www.thorlabs.us/support.cfm?section=7&PageRef=8. user
(posted 2011-11-18 09:35:22.0) is there a limitation on cable length for the distance between the PDP90A and the TQD001? If we extend the cable to 10m, what will happen to the signal integrity/strength? bdada
(posted 2011-12-13 20:23:00.0) Response from Buki at Thorlabs:
A 10m cable will work but we do not have any performance data for various lengths. Please contact TechSupport@thorlabs.com if you have additional questions. user
(posted 2011-11-01 20:27:31.0) A breakout cable or adapter with provides signal outputs on BNC connectors would be very useful. The controller is not needed in our application. bdada
(posted 2011-11-02 18:18:00.0) Response from Buki at Thorlabs:
Thank you for your feedback. We are currently redesigning these detectors to include access to each of the output signals (x, y, and sum) through SMC connectors. We will contact you to provide more information. dario.perez
(posted 2011-09-15 17:12:05.0) On the PDP90A how good is the linear response to the displacements? That is, how far from the detector center can I have the ray and still use the linear approximation. Thx. cchipman
(posted 2011-08-05 13:31:58.0) The depth of the detector within the housing for the PDP90A is not detailed in your drawing (At least that I can find). What is it? jjurado
(posted 2011-08-08 11:54:00.0) Response from Javier at Thorlabs to cchipman: The distance between the active area of the PDP90A and the front plane of the housing is 3.5+/-0.5 mm. infante.cristian
(posted 2010-12-31 01:45:28.0) Im new in optical applications, and i need to calculate the beam centroid with PDP90A. For my application, i will integrate (approx. 10Hz) and sample the outputs, i think that this will decrease error for my application (alignment and tracking) but im not sure. lease mail me to discuss this and other products for centroid detection. Thanks! Greg
(posted 2011-01-11 11:04:13.0) A response from Greg at Thorlabs to infante.cristian: I apologize for the delay in getting back to you. An applications engineer will be in contact with you shortly to discuss centroid detection. infante.cristian
(posted 2010-12-31 01:32:27.0) Im very interested on using PDQ80A to detect the beam centroid. Q1: What signals are available in the outputs (6-pin Hirose)?.
Please mail me to discuss this and other products for centroid detection.
Thanks! Greg
(posted 2011-01-11 10:55:21.0) A response from Greg at Thorlabs to infante.cristian: Based on your feedback, I have added the Hirose pin diagram to the Specs tab. We will contact you to discuss centroid detection. m.j.rossewij
(posted 2010-08-11 16:15:42.0) To handle less intensive light sources, is it possible to increase the gain of the PDQ80A? Thorlabs
(posted 2010-08-10 23:51:57.0) Response from Javier at Thorlabs to kvasnicka: Thank you for your feedback.
A1: The 300 uVrms noise figure is guaranteed over the entire bandwidth of the detector (15 kHz). In reality, the noise is much lower, but we keep this conservative value based on the noise floor of our oscilloscope (HP Infinium 1.5GHz). The total calculated noise values are approximately 51 uVrms (I will send you Excel files with calculations and data).
A2: At 1 Hz, the total noise decreases to about 0.41 uVrms.
A3: At max. optical power, the detector and amplifier circuits are saturated by high input intensity, compromising the reliability of the measured signal.
A4: The PDP90A is not shot-noise limited. In reality the environmental noise should be more of a problem. Laser intensity noise could add to the overall performance, however simultaneously sampling all 3 outputs should minimize this. Background light will certainly add to the errors but in most cases this can be dealt with. Temperature is a larger problem. Ambient temperature changes will affect the accuracy of the readings. The sensor is made up of a standard large area Si photo detector mounted to a resistive subsurface. The position information is distributed to the 4 corners of the sensor based on this proportional resistance to each corner. Temperature changes can affect this resistive network and move the relative position. The worst case occurs when there are temperature gradients across the sensor. Sealing the sensor from air flows will improve this. How well the ambient temperature is controlled will also have an effect.
For digitizing the output, if you were to use a 16 bit A/D card set to a +/-5V input range, the 1 bit resolution is 10V/2^16 = ~150uV. Notice that the calculated values of the noise are less than the resolution of the A/D. Our safe number of 300uV is approximately 2 bits of noise in a 16 bit A/D. This is better than what most cards can specify. For better resolution there are 20 bit cards available. reynolds.gw.2
(posted 2010-07-02 08:41:15.0) Hello,
Im relatively new to the (vast) world of experimental optics. Ive greatly enjoyed browsing your catalog...particularly the application ideas with various products.
I recently was looking at your 4 quadrant photo diode position detectors PDQ80A and PDP90A. In the application idea, you have an application idea for an auto-alignment setup.
Its not clear to me, however, what experimental problem this application is trying to solve. Perhaps a sentence or two in the description would greatly help us newbies. Thus, as we encounter problems, we can look at your applications and discover exactly how the pros solve the problem that we may experience.
In the application, why would the laser beam move around? What advantage does the setup give that makes it supierior to locking down the laser on the table? Thermal drift? Mechanical Vibrations? Laser variability?
Thanks,
Geoff Thorlabs
(posted 2010-07-02 10:39:24.0) Response from Javier at Thorlabs to reynolds.gw.2: thank you for your feedback. The main purpose of the application idea is to show the type of components that you could potentially need to create an active auto-alignment setup for applications in which experimetal results are highly dependent on the alignment of the laser with respect to the optics. There are many factors that contribute to the loss of alignment of a laser in a setup, most of which you mentioned. Thermal drift is perhaps one of the main effects. You can have environmental thermal drift, which can affect the mounting mechanics of the laser (most mounting optomechanics use Aluminum as the main material, which has a high coefficient of thermal expansion), or internal thermal effects that affect the beam pointing stability of the laser. This can be critical in application such as fiber coupling. Also, mechanical vibrations can have negative effect in many experiments, which can be corrected for by using a quadrant or lateral effect sensor. I will contact you directly to discuss your application and the possible uses of these alignment detectors. |

| Item # | PDP90Aa |
|---|---|
| Material | Si |
| Wavelength Range | 320 to 1100 nm |
| Resolution, @ 635 nm | <0.75 µm @ 100 µW, <7.5 µm @ 10 µW |
| Recommended Spot Size | Ø0.2 to Ø7 mm |
 Click to Enlarge
Figure G1.1 The shaded area in this chart shows the min and max input power levels as a function of wavelength. Make sure the incident beam power is as close to the max level for the best resolution and noise figure possible. Going over the max level will saturate the sensor and give erroneous results.
- Lateral Effect Position-Sensing Detector
- Insensitive to Beam Shape and Power Density
- Compatible with SM05 (0.535"-40) Lens Tubes
The PDP90A Position Sensor utilizes a silicon photodiode-based pincushion tetra lateral sensor to accurately measure the displacement of an incident beam relative to the calibrated center. These devices are ideal for measuring the movement of a beam, the distance traveled, or as feedback for alignment systems.
The large detection surface allows a beam diameter of <9 mm; however, our recommended range is 0.2 to 7 mm. Unlike quadrant sensors, which require overlap in all quadrants, the lateral sensor provides positional information of any spot within the detector region, independent of beam shape, size, and power distribution. The PDP90A has a very low noise figure of <2 mVpp (<300 µVrms), which corresponds to a detection error of 0.750 μmrms. Resolution is directly related to the optical input power by the following equation:

where
ΔR is the Resolution,
Lx is the resistance length, 10 mm,
en is the output noise voltage, <300 µVrms, and
Vo is the SUM output voltage level, 4 V max.
Therefore, at the maximum power level, the resolution is 0.75 µm. More detailed technical information can be found in the Operation tab.
Each PDP90A lateral position-sensing detector is packaged with an 8-32 to M4 adapter to provide compatibility with either imperial or metric mounting posts.
Controller
The PDP90A is compatible with the KPA101 controller, available separately below.

| Item # | PDQ80Aa | PDQ30Ca |
|---|---|---|
| Material | Si | InGaAs |
| Wavelength Range | 400 - 1050 nm | 1000 - 1700 nm |
| Detector Bandwidth | 150 kHz | 150 kHz |
| Recommended Spot Size | Ø1.0 to Ø3.9 mm | Ø0.2 to Ø0.5 mm |
- Segmented Quadrant Position-Sensing Detector
- Options Available for 400 - 1050 nm or 1000 - 1700 nm
- Ideal for Automatic Alignment
- Compatible with Four Channel Position Sensing System or a Single Channel K-Cube®
- Compatible with SM05 (0.535"-40) Lens Tubes
The PDQ80A and PDQ30C detectors are segmented, position-sensing, quadrant detectors for precise path alignment of light in the 400 to 1050 nm or 1000 to 1700 nm range, respectively. A 6-pin Hirose connector on each detector outputs signals proportional to the incident beam's power distribution (and thus position). For best results, quadrant detectors should be used with powers under 1 mW (linear regime of sensor) and beam diameters within their specified range. More detailed technical information can be found in the Operation tab.
Each quadrant detector is packaged with an 8-32 to M4 adapter to provide compatibility with either imperial or metric mounting posts.
Thorlabs offers a wide variety of coherent light sources compatible with both quadrant detectors. A selection of appropriate lasers is outlined in the Suggested Lasers tab. For questions about specific light detection arrangements, contact Tech Support.
Controller
The PDQ80A and PDQ30C are compatible with the KPA101 controller, available separately below.

| Item # | KPA101 |
|---|---|
| X & Y Difference Outputs | -10 to 10 V, SMA Connectors |
| Sum Output | 0 to 10 V, SMA Connector |
| Quadrant Detector Input | 6-Pin Hirose Connectora |
| Closed-Loop Bandwidth | Up to 1 kHzb |
| Monitor Mode Bandwidth (-3.0 dB) | 100 kHz |
| Dimensions (W x D x H) | 60.0 mm x 60.0 mm x 49.2 mm (2.36" x 2.36" x 1.94") |

Click to Enlarge
Figure G4.1 Back and Top Views of the KPA101 K-Cube
(See the Full Web Presentation Here for More Information)
- Auto Alignment of Beam to Center of Sensor when in Closed-Loop Mode
- Beam Position Measurement when in Open-Loop Mode
- OLED Menu and Position Display for Complete On-Unit Control
- Voltage Outputs for Sum, Difference, and Feedback Signals
- Full Kinesis® Software Control Suite (See Full Web Presentation for Details)
- Software Compatible with other Kinesis Controllers for Integrated
Systems Development - Multi-Axis Expansion Using Ethernet and USB Controller Hubs (Sold Separately)
- Magnetic, Clip-On Optical Table Mounting Adapter Included
The KPA101 K-Cube® Beam Position Aligner is designed for use with our range of Quadrant and Lateral Effect Sensor Heads. It features a top-mounted control panel with an OLED screen for on-unit control and position readouts. The OLED display includes a backlight that can be dimmed or turned off using the top panel menu options. The front of the unit contains two bidirectional trigger ports that can be used to read a 5 V external logic signal or output a 5 V logic signal to control external equipment. Each port can be independently configured to control the logic level or to set the trigger as an input or output.
The unit is fully compatible with our Kinesis software package. Please note that this module does not ship with a power supply. Compatible power supplies are listed below.
Operation
The KPA101 K-Cube can be controlled by the manual interface on the top of the unit or via a USB connection to a computer running our Kinesis software package. The Kinesis interface allows the auto aligner to be operated in either an open- or closed-loop mode. In both modes, the K-Cube generates a left-minus-right X difference (X DIFF) signal, a top-minus-bottom Y (Y DIFF) difference signal, and a sum (SUM) signal that are displayed on the target screen.
When in open-loop mode, the X DIFF and Y DIFF difference signals shown on the target screen are not output to the SMA connectors on the back of the unit. Instead, the X DIFF and Y DIFF SMA outputs, which represent X OUT and Y OUT position demand signals, will be fixed at zero or the last closed-loop value. This mode allows for manual alignments on the detector. Once roughly aligned, the unit can be set to closed-loop mode to begin automated alignments of the system.
In the closed-loop mode, a DSP processor inside the KPA101 runs two independent feedback loops that output X DIFF and Y DIFF position demand signals. These signals will be present at the SMA connectors on the back of the unit for use as the inputs to the beam steering elements being used to center the beam on the detector. The proportional, integral, and differential (PID) constants can be adjusted to fine tune the response of the feedback loops to changes in the target position. Floating-point arithmetic allows for a greater range of PID coefficients to be used in the control loop, resulting in higher precision and lower noise (see Appendix B of the manual for details). This increases the range of actuators that can be stabilized using the auto aligner. Furthermore, the unit incorporates a notch filter that can be used to counteract the natural resonance of the specific mechanical system in which the unit is being used. This can stabilize actuators that are prone to mechanical resonances, such as piezo mirror gimbal mounts.
When the unit is controlled via the USB interface, the open-loop output of the unit is also exported digitally to the computer. Please note that stable closed-loop operation can only be achieved with continuous wave (CW) lasers. The KPA101 K-Cube is not recommended for use with pulsed lasers.
For more information on the KPA101, please see the full web presentation here.
 Products Home


 Zoom
Zoom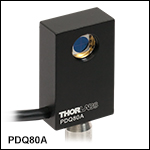
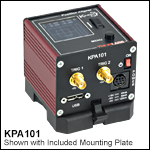
 Photodiode Position Sensing Detectors